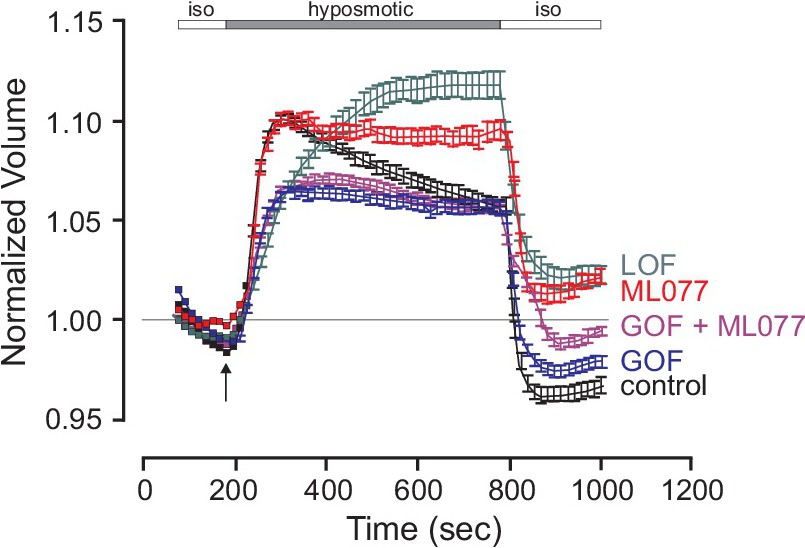
Fig. 4. Osmotic behavior of neurons exposed to a hypotonic challenge. Neurons from wild-type (black), KCC3 knockout (or LOF, green), KCC3-T991A (or GOF, blue), and wild-type exposed to ML077 (red) were exposed to a 40% hypotonic shock. Fluorescence signals were averaged from 3 mice, 152 neurons for controls, 3 mice, 98 neurons for loss of function, 3 mice, 229 neurons for gain of function (T991A), and 3 mice, 134 neurons for the ML077 condition. FΔ/F0 is calculated as the change in fluoresce (intensity value during hypotonic response) divided by the averaged isotonic values. Values are means ± SEM.